Interpreting Varieties Pages
This page explains the terms in the Varieties pages, along with notes on how to inperpret the data presented.
First table of agronomic traits
- Royalty Status Some of our varieties attract a royalty. The royalty gets fed back into our program to help cover the costs. If it applies nurseries should collect this on your behalf.
- Early Yield/Ha Early bearing or precocity is an important ecoonomic trait because it can move the point of positive cash flow forward by a year or more. This means the draw-down on bank balances is less and it reduces the risk as well.
- Later Yield Long term yield is also important for the long term viability of the orchard.
- Kern Recovery Kernel recovery is the percentage of kernel in the complete nut. On average it’s about 33% but high KR varieties attract higher price/kg for nut in shell (NIS) because there is more saleable product in them.
- Whole Kernels The percentage of whole kernels can have a small effect of price. The average is about 45%
- Kernel Wt Kernel mass does not really affect price but there can be buyer push-back on kernels larger than 3.5g. Small nuts can have higher costs for the grower simply because there more of them to process. Average kernel size is about 2.5g.
- First Grade First grade or ‘floaters’ is an indicator of oil content and thus eating quality and roasting characteristics. The average is about 90% which equates to a bit less than 70% oil.
- Flower Season Very early season flowering can be disruptive with some farm operations. See further comments on pollenisers.
- Harvest Season Macadamias are harvested from the ground. The drop pattern will determine when this happens. In some regions early fall can correspond with a rainy season which can result in lost nuts. However later harvest can be disruptive to other tasks.
- Tree Size Generally smaller upright trees are easier to manage.
- Husk Spot Husk spot is a fungal disease that can drop the crop prematurely.
- Sticktights Sticktights is a problem with some trees not dropping their nuts during the main season (or ever). This can result in old nut being mixed in with the next season and it is known to exacerbate husk spot problems.
- Ethrel Response Ethrel is a synthetic version of a natural plant hormone that ripens fruits. It can be used to bring the drop pattern forward but only works with some varieties.
- Abnorm Vertical (AVG) Abnormal Vertical Growth is a syndrome that causes trees to grow into an unusually vertical growth habit and can cause severe and permanent reduction in yield. It happens more in the warmer regions and typically starts about 10 years into the life of an orchard. The cause of AVG is unknown but some varieties are less susceptable than others.
- Pollenisers Not a lot is known about macadamia pollenation but it is reasonable to say that they flower far in excess of what is needed to set a crop. In general a good strategy is to plant varieties with similar flower patterns rather than worry too much about which is the most compatible.
Second table of Gross Incomes
In these tables the calculation is simply
Gross Income/Ha/Yr = Yield NIS/Ha/Yr x Price
The base price for the calculations is $5/kg NIS @ 33% KR, adjusted linearly for kernel recovery.
The values are as recorded in Regional Varietal Trials Series 3, and averaged for Years 4 thru 9 (the first six years of production). Thus, the values given need to be multiplied by six (6) to get the cumulative yield up to year nine of the trial.
They are presented for all sites where the tree was reprsented in the trials.
Non-discounted Gross Revenue/Ha/Yr was chosen in preference to Profit because the latter is too dependent on the different cost structures found among enterprises.
Costs per Ha typically range in the $6000 to $8000/Ha in the industry, thus it can be seen in the tables that some of the genotypes & sites are well into positive cashflow while others are just turning that corner.
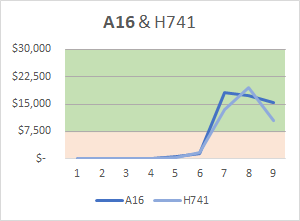
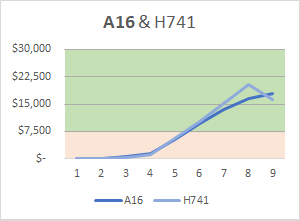
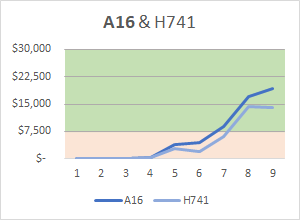
Gross Income vs Year Charts
These charts show the Gross Income at three locations for the first nine (9) years of RVT Series 3. The valaues are calculated in the same way as described above for the Gross Income table.
Where the background changes from orange to green roughly indicates where most operations start to see positive cash flows, around $7,500.


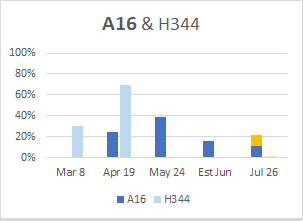
Harvest pattern charts
These charts show drop patterns at two locations, Alstonville in the cooler NNSW region and Booyan in the warmer Bundaberg region.
The bars show the proportion of crop that had fallen at each harvest point in the trial. The variety of interest is shown with H344 for comparison. H344 is a widely known variety with a mid-season drop pattern.
Notes:
- The forth date is an estimate because that data point was skipped.
- The last data point may have an orange section on top. If it is there it represents the proportion of nuts that had not fallen by the last collection point in the trial and had to be hand stripped from the tree. If this is a large value it can be a significant inconvenience for the grower, though in some cases they can be dropped using Ethrel.


Further discussion of RVT Series 3 results is available here.
